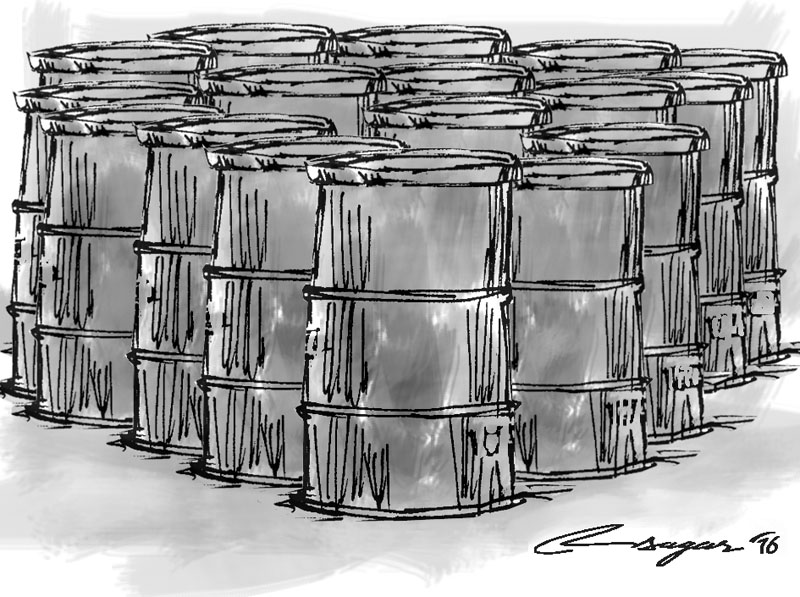
Oil close to a bottom: No sharp rebound
In terms of a price ceiling, our base-case scenario is for oil staying below USD60-65/bbl over the medium term – any higher and marginal shale players become commercially viable once again, driving prices back down
Crude oil prices have plunged more than 60% over the past couple of years and are near their lowest level since 2003, the recent rebound notwithstanding. After taking into account inflation, they’re cheaper than the lows of 1980s and 1990s.
Historically, such a sharp decline in oil prices has been accompanied by a recession and a collapse in energy demand. Yet, the story of oil’s latest decline cannot be more different than those of the past. Far from a recession, global demand for oil has been rising incessantly in recent years, primarily because of soaring demand from China, India and other emerging markets.
What has upended the balance this time? And what, indeed, is the outlook for oil? Getting this right may be critical as it is likely to have a profound effect on global growth and asset prices going forward.
Our base case is for oil averaging around $45-$55/barrel over the next 12-18 months. This is likely to lead to an unprecedented transfer of wealth (amounting to trillions of dollar, according to some estimates) from the world’s oil producers to the consumers. Since the world’s biggest economies are all net consumers of oil (US, Europe, China, Japan and most of Asia), such an outcome should be positive for global growth. However, we may have to ride through quite a bit of volatility on the way. The game changer this time – and the source of ongoing volatility - is the so-called ‘shale revolution’ in the US, where oil producers have employed a new horizontal drilling technology to extract vast reserves under rock formations deep below the earth’s crust. This method has been so successful that US output, after two decades of decline, has soared from around 5 million barrels per day (mbpd) in 2008 to above 9 mbpd in 2015, turning the US into the world’s largest oil producer.
However, it was the competitors’ response to this US supply shock which dealt the final blow to oil prices – instead of accommodating the new-stream of supplies, Saudi Arabia and Russia, the world’s two other leading producers, decided to maintain their output and preserve their market share.
The medium-to-long term picture for oil is easier to construct. Most estimates point to excess global supply of about 1.0-1.5mbpd at the end of 2015. Annual demand growth tends to average about 1 mbpd in non-recessionary years. Indeed, recent data suggests demand from the developing world shows no signs of slowing. This means the global demand-supply gap could close over the next 12-18 months.
This outlook is likely to be supported by supply cutbacks by producers, largely in the US and Canada, who are no longer viable at these prices and are not able to access funding. We are already seeing such pressures among some of the smaller US shale oil producers. As a result of these shutdowns, US output has fallen since peaking in June 2015.
Iranian production is a wildcard, now that export sanctions against OPEC’s fourth-largest supplier has been lifted. Iran’s oil output in the short-term is likely to be limited by the lack of investment over the past decade. In the longer term, new investment in oil infrastructure could mean significant new Iranian output. The near-term outlook for prices is murkier as oil may be driven by a host of factors. Among the positive near-term drivers, measures of market sentiment are at cyclical lows and equities and bonds in the energy sector are already quite distressed, which may lead to supply cutbacks from marginal producers and support prices. Meanwhile, limited excess supply in the system means that even a relatively small ‘accident’ anywhere could lead to a bounce in prices. Such an ‘accident’ could be geopolitical in nature.
However, there is a risk prices could decline further on the back of positive surprise in supplies, notably from Russia where output continues to surge, or Iran. Similarly, a further surge in the US dollar could hurt oil prices (as the two tend to move inversely). Geopolitics could dampen prices as well - the rivalry between Saudi Arabia and Iran may lead the Saudis to keep pumping to ensure prices stay low, denying Iran a revenue boost.
Recent speculation that oil could fall to $20 or lower come from the charts – oil bounced back from $20/barrel in 2001; before that, it rebounded from around $10 in 1998. While these levels seem far-fetched today, we could get there under a worst-case scenario of a world running out of storage capacity or in the event of a global recession (which we do not currently foresee). However, marginal producers would become unviable at these levels, eventually driving prices higher. In terms of a price ceiling, our base-case scenario is for oil staying below USD60-65/bbl over the medium term – any higher and marginal shale players become commercially viable once again, driving prices back down. Thus, in the next 12-18 months, a range of $45-$55 seems appropriate.
We would prefer longer-term strategies that benefit from modestly (as opposed to sharply) higher oil prices. This could include exposure to the energy sector through equities or US high yield bonds and oil-dependent currencies such as the Canadian Dollar. Be sure to gird yourself against near-term volatility, though.
Gill is Head of Fixed Income, Currencies and Commodities Strategy at Standard Chartered Bank’s Wealth Management Unit


