


Capacity utilisation of industries rises to 58pc
Average capacity utilisation of Nepali industries rose to 58 per cent by the first sixth month of the current fiscal 2017-18, compared to 54.2 per cent in the corresponding period of the previous fiscal, according to Nepal Rastra Bank (NRB).
High capacity utilisation of industrial plants means Nepali industries are becoming efficient in production of goods. Capacity utilisation of domestic industries is currently at the highest level, when data of the last five years is compared. This shows improving scenario in industrial sector, as per the central bank.
The Economic Activities report of the central bank was prepared based on the study of major industries in seven economic blocs of the country - Biratnagar, Janakpur, Birgunj, Pokhara, Bhairahawa, Nepalgunj and Dhangadhi. The capacity utilisation of industries improved along with regular electricity supply and end to frequent strikes from political parties and labour unions, according to the central bank report.
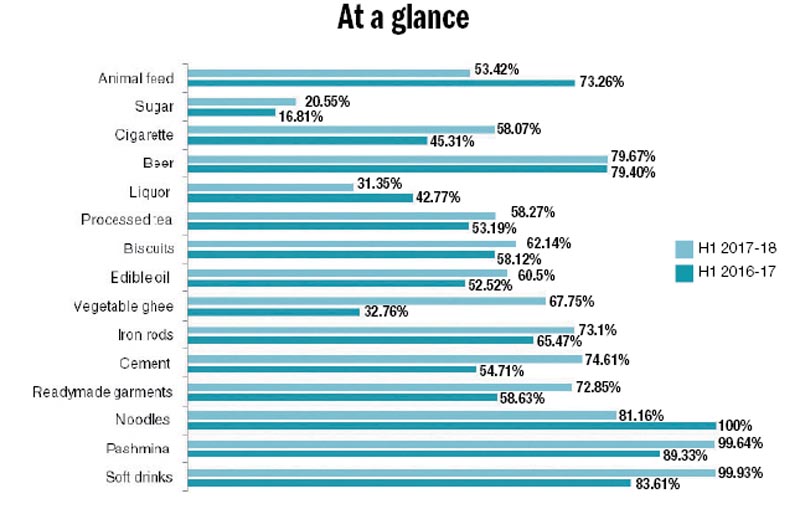
Capacity utilisation of soft drinks saw significant improvement to 99.93 per cent in the first half of 2017-18 compared to 83.61 per cent in the corresponding period of the previous fiscal.
Similarly, the capacity utilisation of pashmina-related industries rose to 99.64 per cent in the review period compared to 89.33 per cent in the previous fiscal. “High capacity utilisation of export-oriented industries like pashmina means there is potential of increasing export of pashmina products,” said Nara Bahadur Thapa, executive director of Research Department at NRB, adding the report has urged industrialists to raise the installed capacity of their industries.
Likewise, capacity utilisation of other export-oriented industries, namely readymade garments (RMGs) went up to 72.85 per cent from 58.63 per cent in the corresponding period of previous fiscal.
Most importantly, the report has also shed light on increasing capacity utilisation of industries that produce construction materials, like cement, rods, among others, and the potential of consumption of construction materials, as the post-earthquake reconstruction and construction of government buildings, infrastructure is peaking in the sub-national governments..
The capacity utilisation of sugar industries was the lowest at 20.55 per cent in the review period. Though the government has aimed at becoming self-reliant in sugar production, the capacity utilisation of this industry was substantially lower than the average for Nepali industries. The central bank report has highlighted that the sugar mills have failed to maximise their installed capacity utilisation due to lack of raw materials (sugarcane) in the crushing season.
“Farmers are discouraged to grow sugarcane as the sugar factories have huge outstanding dues with cane growers,” said the NRB report, “This could dampen the government's plan to be self-reliant in sugar production in the country if the fundamental problem is not addressed timely.”
Thapa of NRB said that the increase in capacity utilisation will contribute towards rise of industrial output and ultimately support to raise economic growth. The share of manufacturing in gross domestic product (GDP) stood at 9.2 per cent in 2000-01, but it has been gradually coming down in the recent years. It stood at just 5.4 per cent in the current fiscal.
In this context, increasing capacity utilisation could revitalise the Nepali industries that were badly affected due to the political insurgency along with compounded problems like frequent strikes, labour unrest, erratic power supply and high interest rate of bank's credit, among other, according to Hari Bhakta Sharma, president of Confederation of Nepalese Industries (CNI). “The government and private sector should work together to lower the cost of production by resolving various inefficiencies in our system and make our production more competitive.”
The central bank has been publishing the report twice a year - on half-yearly and annual basis.
Comparative figures of H1
FY 2013-14 ........................49.9%
FY 2014-15.........................51.3%
FY 2015-16..........................48%
FY 2016-17.........................54.2%
FY 2017-18..........................58%
Source: NRB
